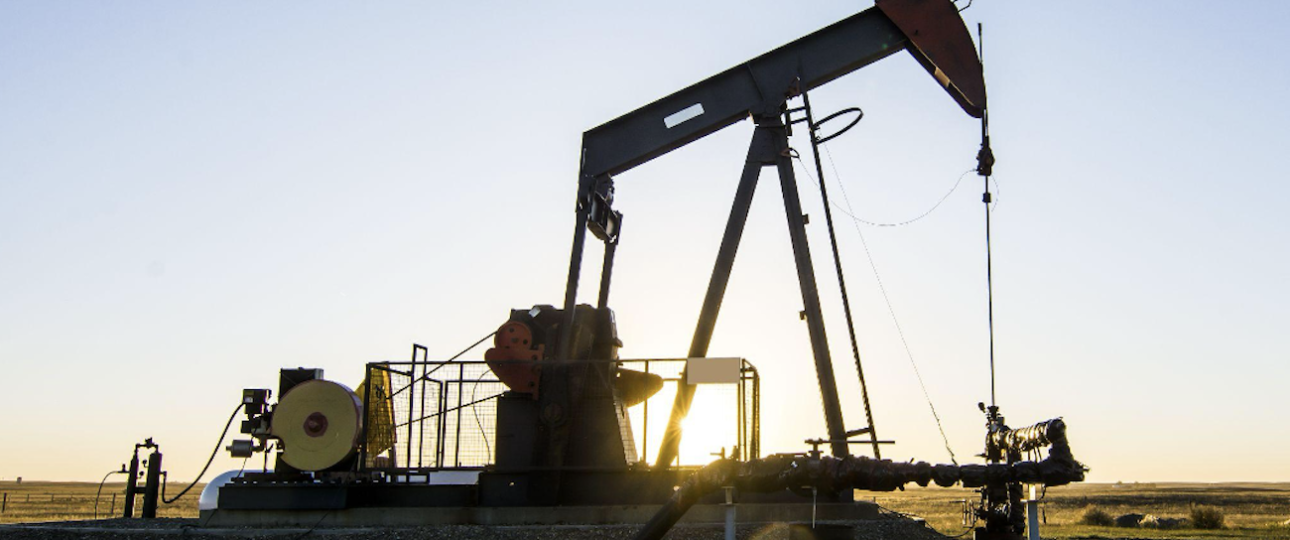
The scale of Alberta’s oil sands toward Fort McMurray is hard to miss. Less obvious is how the province’s energy industry affects Canada’s economy and, in turn, the value of its currency.
The numbers help explain why. According to the Fraser Institute, Alberta produced 85% of Canada’s oil and roughly three-fifths of its natural gas in 2023. Energy also accounts for about one-quarter of the country’s international exports. When one province carries that much of a nation’s export income, developments in its oil and gas sector can influence the Canadian dollar.
Currency Watchers Keep One Eye on Alberta
The Canadian dollar has long been described as a commodity currency because its value can respond to changes in global commodity prices. Foreign buyers pay for Canadian crude largely in U.S. dollars. When producers convert those earnings to Canadian dollars back home, this can increase demand for the currency. Higher oil prices can also boost export revenues and encourage further investment in the energy sector.
That is why oil headlines appear alongside interest rate news for anyone following USD/CAD. Someone checking prices on a forex trading app during a busy week will often see crude and the loonie discussed in the same context. Alberta’s large contribution to Canada’s oil production helps explain this connection.

How Alberta Came to Dominate Canadian Energy
Most of Canada’s oil reserves are located in Alberta, with the majority found in the oil sands. Production keeps growing, too, according to Statistics Canada. According to the recent report, oil sands production rose again in 2025, helping lift national crude output to new highs.
The growth has been backed by substantial investment. According to the Alberta Energy Regulator, capital expenditures across the province’s crude oil, natural gas, oil sands and emerging resources sectors reached C$32.4 billion in 2025, the highest level in a decade. For the currency, those dollars matter as much as the barrels. Foreign money flowing into oil sands projects can increase demand for Canadian dollars.
Alberta’s latest economic outlook also highlights the importance of the energy sector to the provincial economy. Alberta’s latest economic outlook credits higher commodity prices for an improved picture, with real GDP now expected to grow 2.3% in 2026.
New Export Markets Affect Canadian Oil Prices
For decades, the United States has been the main destination for Canadian crude oil exports. In 2023, about 95% of those exports went south of the border, leaving Canadian producers heavily reliant on one market.
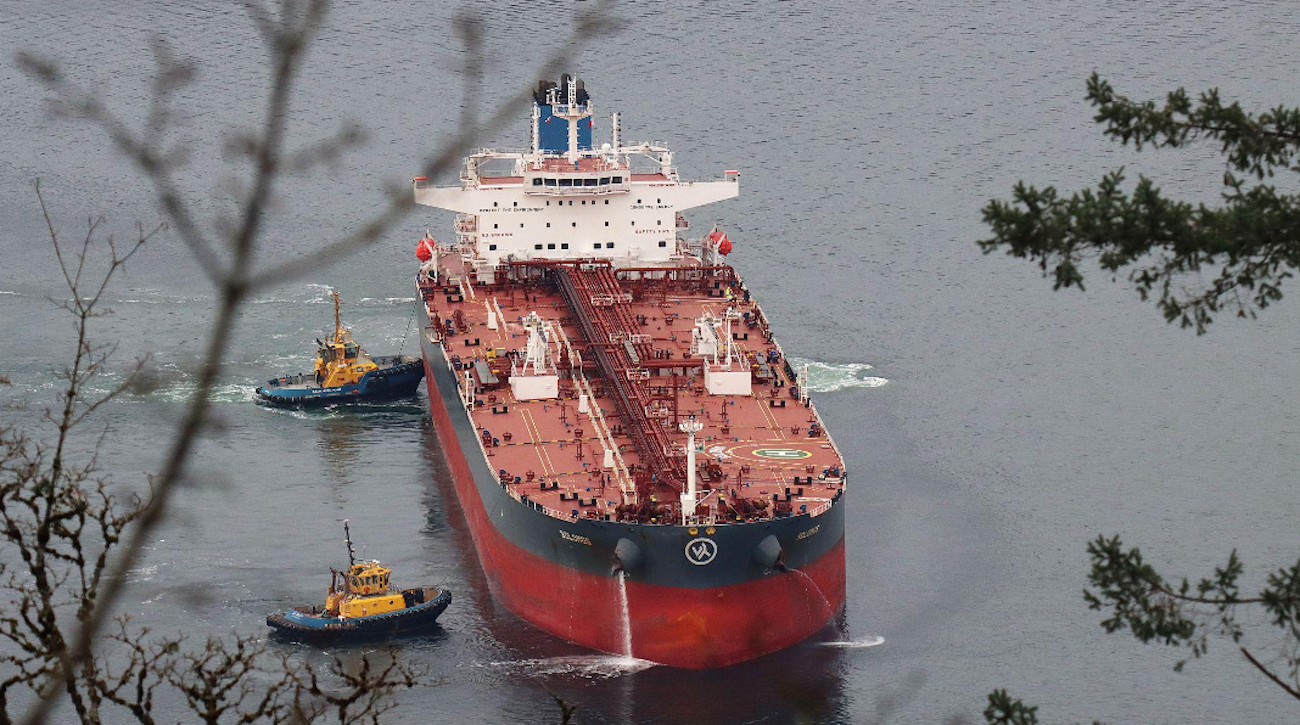
The Trans Mountain Expansion changed that equation when it entered service in May 2024, roughly tripling the line’s capacity to 890,000 barrels per day and opening a route to the Pacific. Just over 10% of Canadian crude exports went to destinations other than the U.S. in 2025, according to Statistics Canada. This is more than three times the average share recorded between 2016 and 2024. Trans Mountain’s chief executive also reported in September that about two-thirds of tankers leaving the Westridge Marine Terminal were bound for Asia, with further capacity additions planned through 2028.
Access to more export markets has also helped Canadian producers secure better prices for their crude relative to international benchmarks. The average price difference between West Texas Intermediate (WTI) and Western Canadian Select (WCS) narrowed to US$11.14 per barrel in 2025, down from US$14.73 in 2024. For currency watchers, that means more export revenue per barrel and less dependence on one buyer, a point that carried extra weight during the cross-border trade disputes of the past two years.
When the Oil Link Loosens
The relationship between crude oil prices and the loonie is well established, but the two do not always move in tandem.
A clear example of this link came during the oil slump of 2014 to 2016. Crude fell from more than $100 US a barrel in mid-2014 to around $30 by early 2016, and the Canadian dollar slid from above 90 US cents to below 69 cents in January 2016, its lowest level in more than a decade.
Recent market movements show why the relationship is not always straightforward. WTI crude climbed back above $100 a barrel in late October amid supply disruptions in the Middle East, yet the loonie has spent much of the year in the low 70-cent range. Economists at Scotiabank offered one explanation in an April 2026 analysis. Their research found the Canadian dollar responds far more strongly to oil rallies driven by global demand than to those caused by supply shocks, which markets tend to treat as temporary. Interest rate gaps with the U.S. and broad swings in the U.S. dollar also influence the outcome.
There is a structural reason as well. Energy investment fell sharply after the 2014 collapse and never returned to its earlier peak. As a result, Canada’s economy is somewhat less sensitive to oil swings than it was a decade ago.
What This Means for Anyone Following CAD
Alberta’s energy sector remains an important influence on the Canadian dollar, but oil prices are only part of the picture. Oil inventory reports, the price gap between WCS and WTI, pipeline announcements and monthly trade figures all feed into how the loonie behaves, alongside central bank decisions.
For Albertans, the connection between the energy sector and the wider economy is especially clear. What happens in the oil patch travels well beyond Calgary and Edmonton, influencing export earnings, investment and the Canadian dollar’s value against other currencies. Understanding when that relationship strengthens or weakens makes the loonie easier to follow.